Linux monitoring and diagnostics · terminal UI
CPU at 100 %. Tirnix tells you why, and how to check.
It shows that the load stayed high for 30 seconds, which processes did it, what usually causes that and which commands confirm it, while keeping measured facts and guesses apart. One 1.5 MB static binary. No root, no daemon, no telemetry.
- Latest0.2.0
- Binary~1.5 MB, static (musl)
- Archx86_64 · aarch64
- Packages.deb · .rpm
- LicenseGPL-3.0-or-later
$ tirnix report
CPU      100% busy (user 100%, system 0.0%, iowait 0.0%, steal 0.0%)
Load     3.45 1.27 0.52
Memory   823 MiB used of 3.82 GiB (3.02 GiB available)
…
[WARN] Filesystem /data is 94% full
  measured: 9.44 MiB used, 572 KiB available of 10.0 MiB (tmpfs on tmpfs).
  possible cause: Growing log files or journals.
  …
  verify: du -xh --max-depth=2 /data 2>/dev/null | sort -h | tail -20
Every finding has three parts
Rate-based rules need a sustained condition, so a single spike doesn't raise an alarm.
What the kernel actually reports, with numbers. A missing source shows as n/a, never an estimate.
What usually leads to this, marked plainly as a hypothesis.
The commands that confirm or rule it out, ready to paste.
It finds the source, not just the symptom
Packet drops
Traced to the UDP socket, the listen queue, the NIC ring, the CPU backlog or the conntrack table, and to the process behind it.
A full disk
Names deleted files that are still held open and the processes writing to the disk.
Slow leaks
Processes that keep growing are flagged as leak candidates.
Blocked tasks
Says whether they wait for NFS, the disk or a journal.
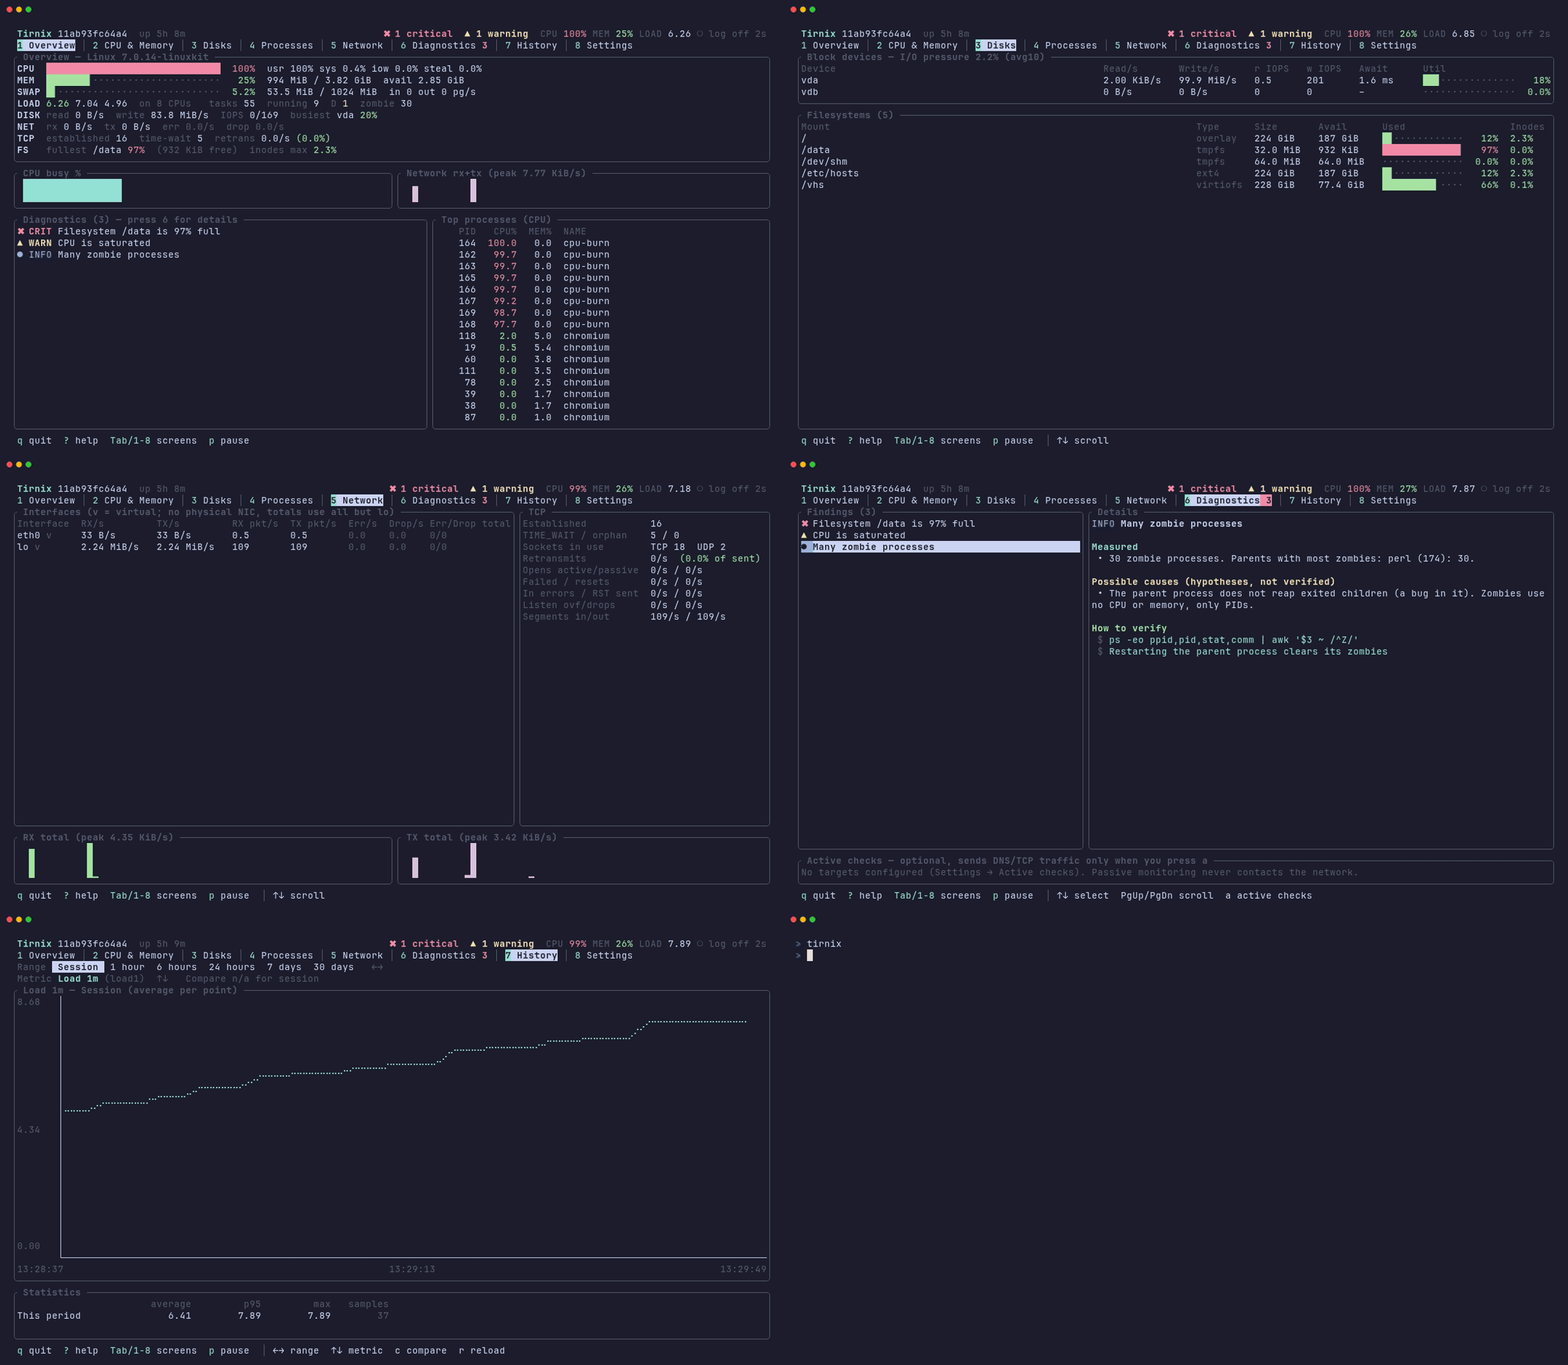
Eight screens, one key each
Works over SSH, in small terminals, without root. ASCII fallback for non-UTF-8 locales and NO_COLOR
support. The footer always lists the keys of the current screen.
p pauses, + - change the refresh rate, ? shows all keys, q quits.
| Key | Screen | What you get |
|---|---|---|
| 1 | Overview | CPU, memory, swap, load, disk and network, TCP, fullest filesystem, findings, top processes |
| 2 | CPU & Memory | per-core usage, PSI, swap, major faults, OOM kills |
| 3 | Disks | throughput, IOPS, await, utilisation, space and inodes |
| 4 | Processes | sortable, with disk I/O and full command line, filter |
| 5 | Network | errors, drops, retransmissions, drop analysis |
| 6 | Diagnostics | findings, data source coverage, active checks |
| 7 | History | any metric from 1 hour to 30 days, compared with the previous period |
| 8 | Settings | refresh, background logging, retention, size limit |
Lighter than the problem it finds
Measured on Linux 7.0, aarch64 with 8 CPUs, in a container with about 300 processes, 60 seconds each.
The optional logger keeps sampling after you close the TUI, with retention and a size limit: about
4.6 MiB a day at the default 10-second interval. Its systemd unit rates 1.1 in
systemd-analyze security.
| Mode | CPU, one core | Memory |
|---|---|---|
| TUI, Overview, 2 s | 0.6 % | 2.1 MiB |
| TUI, Processes, 2 s | 0.8 % | 2.2 MiB |
| Logger, 10 s | 0.05 % | 1.5 MiB |
| Logger, 1 s | 0.23 % | 1.5 MiB |
Install
Runs on any Linux distribution: tested on Debian 12, Ubuntu 24.04, Fedora 42 and Alpine 3.22. Kernel 4.20 or newer recommended for pressure stall information.
Install script
Verifies the download against the release's SHA256SUMS and installs one file, ~/.local/bin/tirnix. Read it first if you like.
$ curl -fsSL https://raw.githubusercontent.com/Gelluithor/Tirnix/main/install.sh | sh
Packages
From the releases page. They install the binary and optional systemd units. No service is started.
$ sudo apt install ./tirnix_0.2.0-1_amd64.deb
$ sudo dnf install ./tirnix-0.2.0-1.x86_64.rpm
From source
Rust 1.88 or newer. Other architectures build fine.
$ git clone https://github.com/Gelluithor/Tirnix && cd Tirnix
$ cargo build --release
Next time a server feels slow
Run tirnix before you start guessing. Or put tirnix report --seconds 30 into a
script and get the findings as text.
$ tirnix                      # interactive TUI
$ tirnix report --seconds 30  # summary and findings
$ tirnix logger start         # keep history
$ tirnix export --since 24h --format csv